AMPOWER Report 2021: METAL
Table of contents

Metal Additive Manufacturing Market

Entire market summary

  • Metal and polymer AM market size 2020 and 2025
  • Regional distribution of system sales revenue in 2020 and 2025
  • System sales revenue by industry 2020
  • System sales revenue by technology 2020 and 2025

Metal market summary


Market size

  • Metal AM market size
  • Metal market size and growth 2020 and 2025
  • Metal market growth 2020 and 2025 – supplier vs. buyer
  • Metal AM installed base 2020 and 2025 – supplier vs. buyer
  • Market comparison with CNN

Market by region

  • Regional metal market of buyers 2020 and 2025
  • Regional metal market of system sales 2020 and 2025
  • Regional metal market of system suppliers by countries 2020 and 2025
  • Origin of metal system suppliers by technology 2020 and 2025
  • Origin of metal system suppliers of installed Powder Bed Fusion machines 2020 and 2025
  • Focus region EMEA – metal system sales 2020 and 2025
  • Metal part manufacturing service in AMER and EMEA by industry 2020 and 2025

Market by technology

  • Metal system sales by technology 2020
  • Installed metal base by technology 2020
  • Metal technology market share 2020 and 2025
  • Metal machine sales by technology 2020 and forecast 2025 – supplier vs. buyer
  • Installed base by metal technology 2020 and 2025 – supplier vs. buyer forecast
  • Number of lasers in Powder Bed Fusion machines 2020 and 2025
  • Supplier origin of sold metal machines 2020

Market by industry

  • Metal system sales by industry 2020
  • Metal system sales by industry 2020 and 2025
  • Sold metal systems by industry 2020
  • Installed metal base by industry 2020 and 2025

Market by material

  • Metal feedstock use 2020 and 2025
  • Metal material use by industry 2020 and 2025

Degree of industrialization

  • Metal system utilization
  • Metal part quantity per year
  • Purpose of metal parts

Figures and Tables

Entire market summary

  • Figure Metal and Polymer Additive Manufacturing market 2020 and supplier forecast 2025 [EUR billion]
  • Figure Global distribution of buyers by system sales revenue 2020 and forecast 2025 [EUR million]
  • Figure System sales revenue by industry 2020 [EUR billion]
  • Figure System sales revenue by technology 2020 and supplier forecast 2025 [EUR billion]

Market size

  • Figure Metal Additive Manufacturing market 2020 and supplier forecast 2025 [EUR billion]
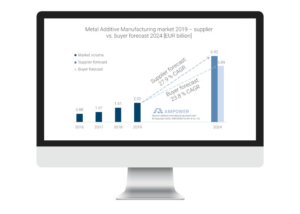
  • Figure Metal Additive Manufacturing market 2020 – supplier vs. buyer forecast 2025 [EUR billion]
  • Figure Metal AM installed base 2020 and supplier vs. buyer forecast 2025 [units]
  • Figure Annual metal AM system sales 2020 and forecast 2025 [units]
  • Figure Metal AM vs CNC system market 2020 and supplier forecast 2025 [EUR billion]

Market by region

  • Figure Regional distribution of buyers by system, material and service sales revenue 2020 and supplier forecast 2025 [EUR billion]
  • Figure Regional distribution of buyers by system, material and service sales revenue share 2020 and supplier forecast 2025
  • Table Regional distribution of Metal machines sales and average unit revenue in 2020
  • Figure Regional distribution of buyers by metal system sales revenue 2020 and supplier forecast 2025 [EUR billion]
  • Figure Global distribution of buyers by system sales revenue 2020 and supplier forecast 2025
  • Figure Origin of metal system suppliers by installed systems and technology 2020 and supplier forecast 2025 [units]
  • Figure Origin of metal system suppliers of installed PBF machines 2020 and supplier forecast 2025 [units]
  • Figure Regional focus EMEA – origin of metal system suppliers by sales revenue 2020 and supplier forecast 2025 [EUR billion]
  • Figure Metal part manufacturing service revenue in AMER and EMEA by industry 2020 and forecast 2025 [EUR billion]

Market by technology

  • Figure Metal Machine sales by technology 2020 [units]
  • Figure Number of metal system supplier companies by technology 2020
  • Figure Installed Metal base by technology 2020 [units]
  • Figure metal System sales revenue by technology 2020 and supplier forecast 2025 [EUR billion]
  • Figure Metal machine sales by technology 2020 and supplier vs. buyer forecast 2025 [units]
  • Figure Metal machine sales by technology 2020 and supplier vs. buyer forecast 2025 – share of units
  • Figure Trend of PBF machine sales 2020 to 2025 – supplier vs. buyer forecast [units]
  • Figure Installed base by metal technology 2020 and supplier vs. buyer forecast 2025 [units]
  • Figure Installed base by Metal technology 2020 and supplier vs. buyer forecast 2025 – share of units
  • Figure Share of number of lasers per Powder Bed Fusion machine in 2020 and supplier and buyer forecast 2025
  • Figure Origin of suppliers by share of sold metal machines 2020 [units]

Market by industry

  • Figure Metal system sales revenue by industry 2020 [EUR billion]
  • Figure Metal system sales revenue by industry 2020 and supplier forecast 2025 [EUR million]
  • Figure Metal system sales revenue by industry 2020 and supplier forecast 2025 – share of sales revenue
  • Figure Sold metal systems by industry in 2020 [units]
  • Figure Installed base of metal AM machines by industry 2020 and supplier forecast 2025 [units]

Market by material

  • Figure Metal material consumption 2020 and forecast 2025 [ton]
  • Figure Metal material consumption by industry 2020 and forecast 2025 [ton]

Degree of industrialization

  • Figure Average metal system utilization by industry 2020
  • Figure Part quantity per year of metal Additive Manufacturing components 2020
  • Figure Application category of printed parts 2020 and forecast 2025